Volume demand has stabilized heading into the holiday season
- Year to date, the category continues to improve with volume now flat, while dollar sales are growing +1.7%
- Fruit has performed better than vegetables, but Thanksgiving should lift vegetable category this month
- Center store inflation lingers, but is improving

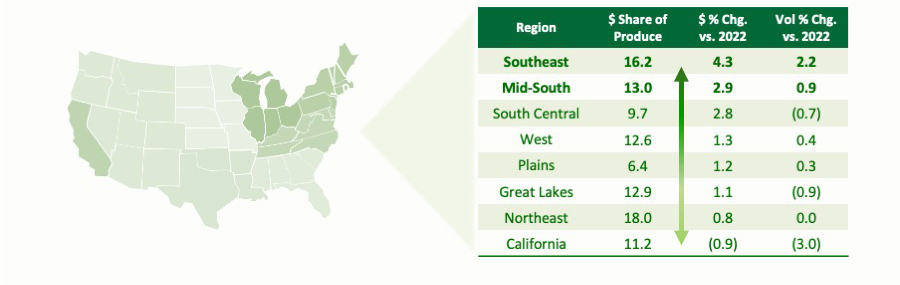
Regional Performance YTD (44 weeks)1
Regional performance impacted by customer mix and population shifts.
Top 10 Fruit and Vegetables $1
- Many inelastic commodities were resilient in the inflationary environment.
- Higher register ring items like salad kits continue to struggle as consumers trade down in category.

Shoppers are Engaged... Still Paying More for Less2
- Produce buyers continue to make more trips to buy Fruits and Vegetables and spending more dollars per trip. However, they are still walking away with less volume than they were a year ago.2
- With increased store traffic in value retailers (see below), traditional grocery retailers continue to review margins, adjust assortment, and center strategy on loyalty and keeping shoppers engaged.

Price driven channel shifting continues2
- Although still the largest channel of Produce, Traditional Grocery continues to lose share of market to more value focused retailers such as Walmart and Club.
- Larger grocery retailers are holding steady with loyalty offers and digital presence…as smaller chains and independents are losing share

Inflation Update1
- Inflation has eased within produce, but prices are still elevated vs 2021.
- Promotional strategies must incorporate increased cost of goods and subsequent “new” base price norms.
- Frequency is still needed, but depth of promotions will need to be reviewed

The most visible marketing strategy is your promotional strategy

Category management thought leadership is crucial for success in today’s environment

Robinson Fresh can help in 2024
PRODUCT AND PLACEMENT
- Information Advantage: Market and Customer level insights
- Shopper Panel data and surveys
- Data centric space reviews geared to optimize assortments and merchandising.
- JDA Space management support – Industry standard
PRICE AND PROMO
- We analyze how variables such as weather, seasonality, location, and store format play into an item’s price elasticity to help you maximize your category’s results
- Everyday Price / Promo Responsiveness
- Seasonal and Holiday promotional reviews
SHOPPER RETENTION
- Regional demographic analysis to align messaging to YOUR shopper
- Cross Purchase behavior studies
- Recipes that promote basket building
- We can assist in the development of in store POS with corresponding eCommerce messaging
OMNI CHANNEL
- The most visible marketing strategy is your promotional strategy, so we focus on aligning that messaging thru an Omni lens (In store/eCommerce)
- Marketing collateral to support the digital shopper journey
- Dedicated eCommerce resource to provide expertise on how to improve the efficiency of your website
- Circana Integrated Fresh, Total US, MULO, Calendar Year 2023 Ending 11.5.23
- Circana Panel Data, Total US- all outlets, Calendar Year 2023 Ending 11.5.23